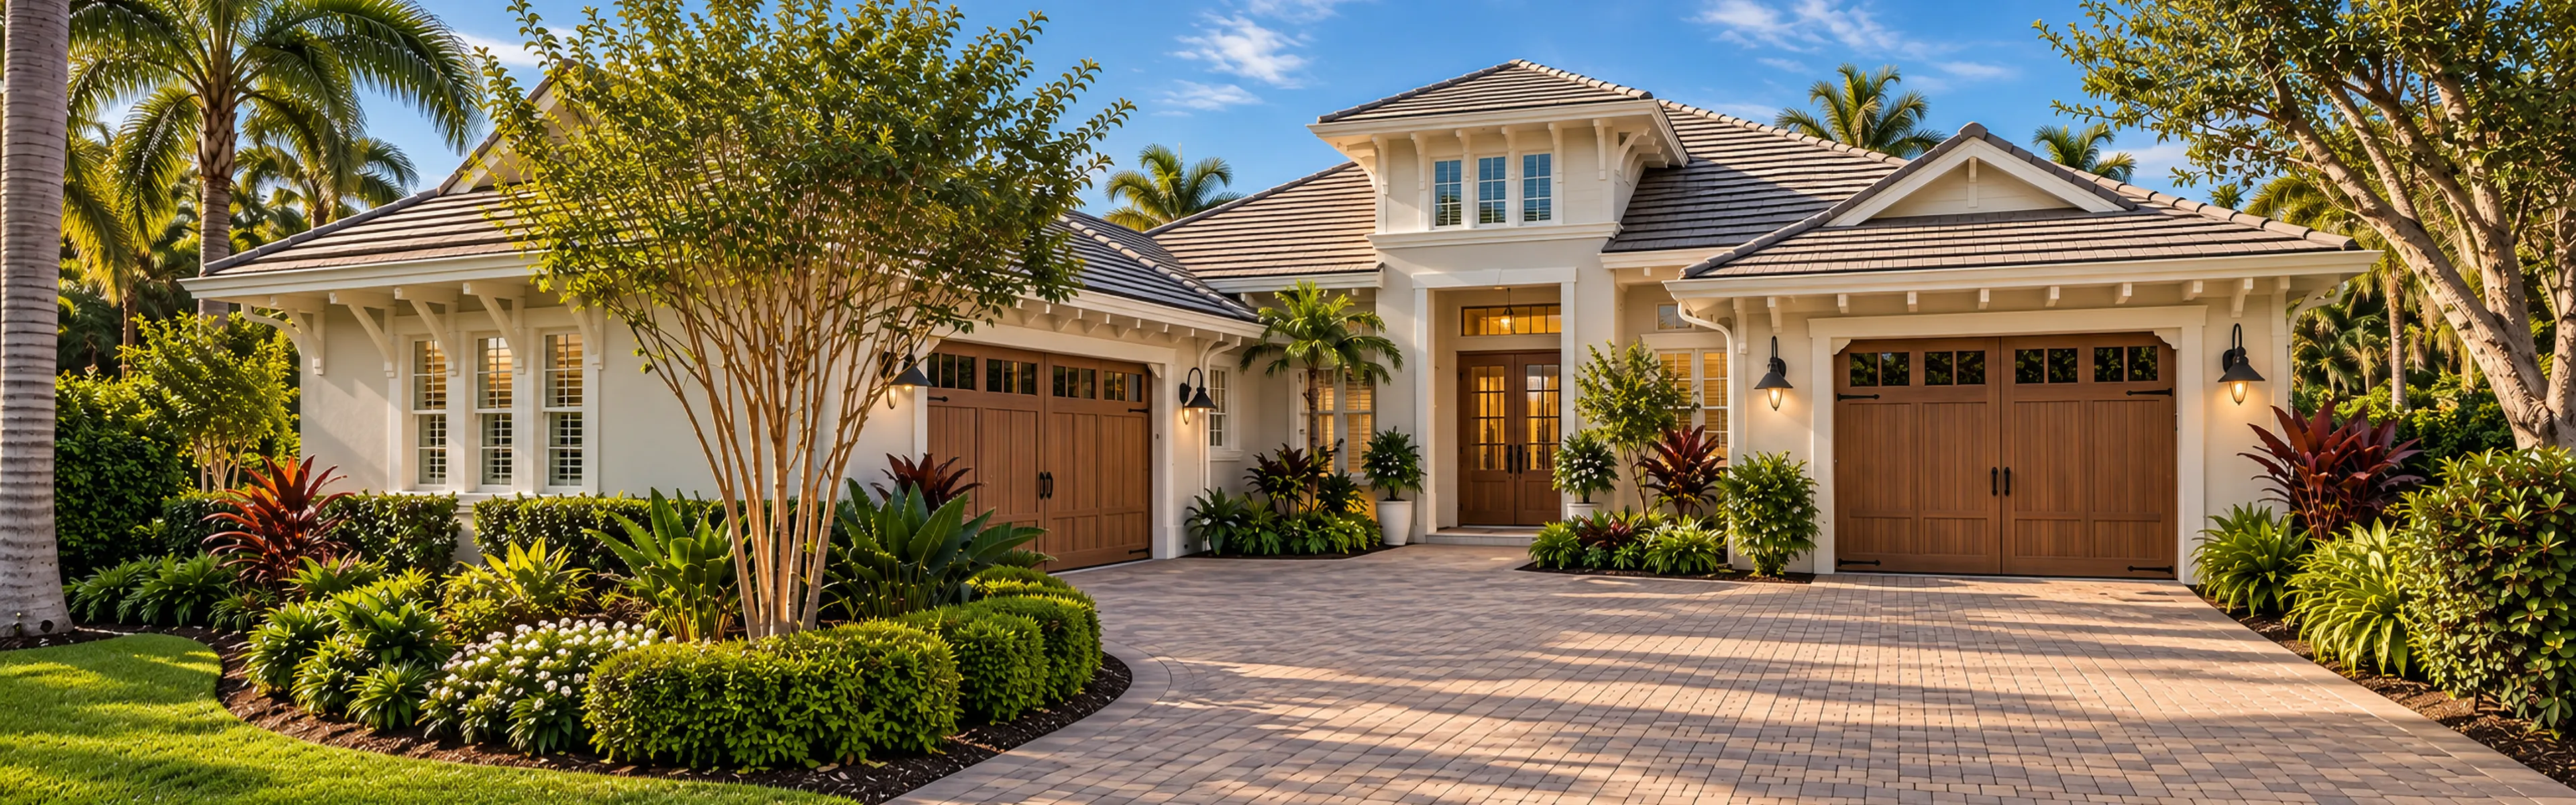
Naples Homes For Sale & Real Estate
Homes in Naples, Florida
Search homes for sale in Naples, Florida below, from Gulf-front estates in Port Royal and Old Naples to golf-community homes in Grey Oaks and Quail West and acreage in Golden Gate Estates. Single-family homes in Naples sold for a median $825,000 in 2026, across 3,426 closed sales through 30 September, up 4.9% from $786,250 in the same months of 2025. Sales rose 11.6%, homes sold in a median 58 days at 95.6% of list price, and luxury homes of $1 million or more made up 40% of sales and 77% of the dollar volume. With 1,777 homes listed and about 4.7 months of supply, the Naples real estate market sits close to balance overall: tight under $500,000, with buyers holding more leverage above $5 million.
Quick Facts
- 3,426Home sales, 2026 Q1–Q3
- $825,000Median sold
- $575,000 to $1,603,000Middle half of sales
- $387Median per sq ft
- 58Median days on market
- 95.6%Sold to list price
- 1,362 (40%)Sales $1M and above
- 4.7Months of supply
NABOR MLS closed sales, Naples single-family homes, 1 Jan to 30 Sep 2026; active listings 30 Sep 2026.
Naples Homes for Sale


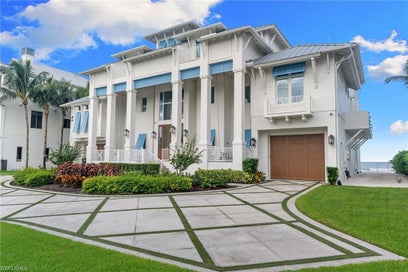


We Love Talking About
Naples Homes
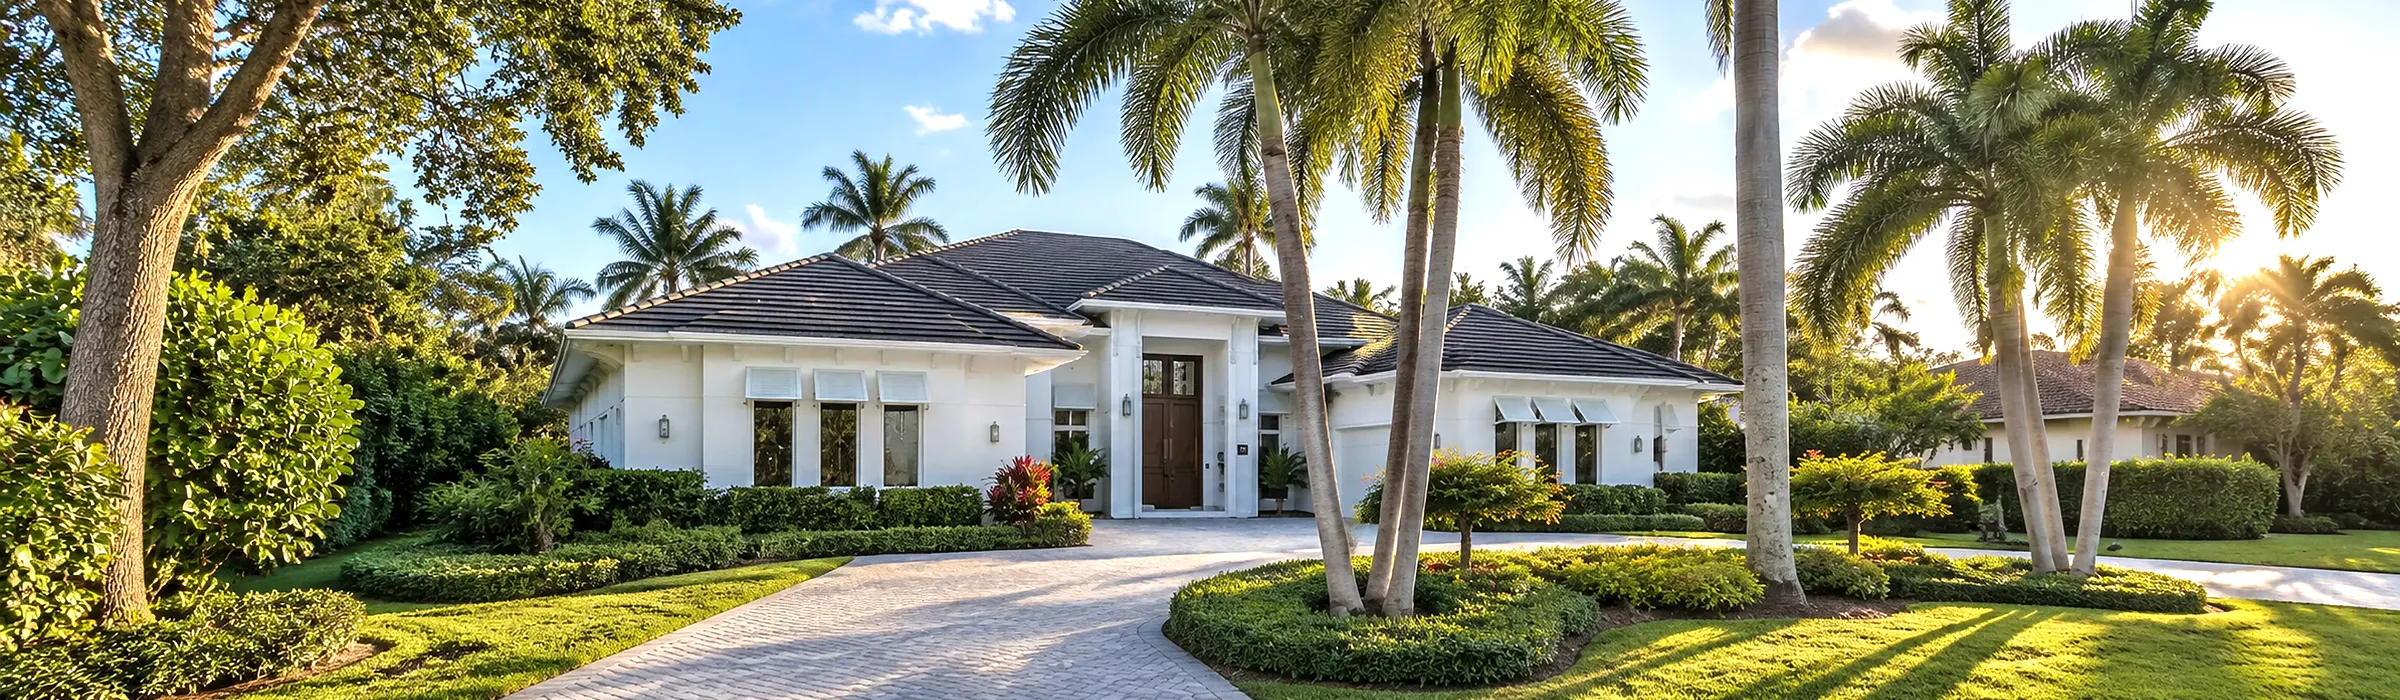
Naples Real Estate Market in 2026
The Naples single-family market is busier and slightly firmer than a year ago. Comparing January to September of each year, closed sales rose 11.6% and the median price rose 4.9%, while homes sold 5 days faster and closer to their list price.
The top of the market moved most. Sales of $1 million and above rose 17.5%, and their median climbed 8.3% to $1,950,000. For all of 2025, Naples recorded 4,042 home sales at a median $785,000. For deeper analysis, see our Naples real estate market research.
| Measure | 2025 Q1–Q3 | 2026 Q1–Q3 | Change |
|---|---|---|---|
| Closed sales | 3,070 | 3,426 | +11.6% |
| Median sale price | $786,250 | $825,000 | +4.9% |
| Median price per sq ft | $378 | $387 | +2.3% |
| Median days on market | 63 | 58 | -5 days |
| Sold to list price | 95.2% | 95.6% | +0.4 pts |
| Sales $1 million and above | 1,159 | 1,362 | +17.5% |
| Median $1M+ sale | $1,800,000 | $1,950,000 | +8.3% |
| Sales $5 million and above | 166 | 206 | +24.1% |
| Dollar volume | $5.01 billion | $5.82 billion | +16.0% |
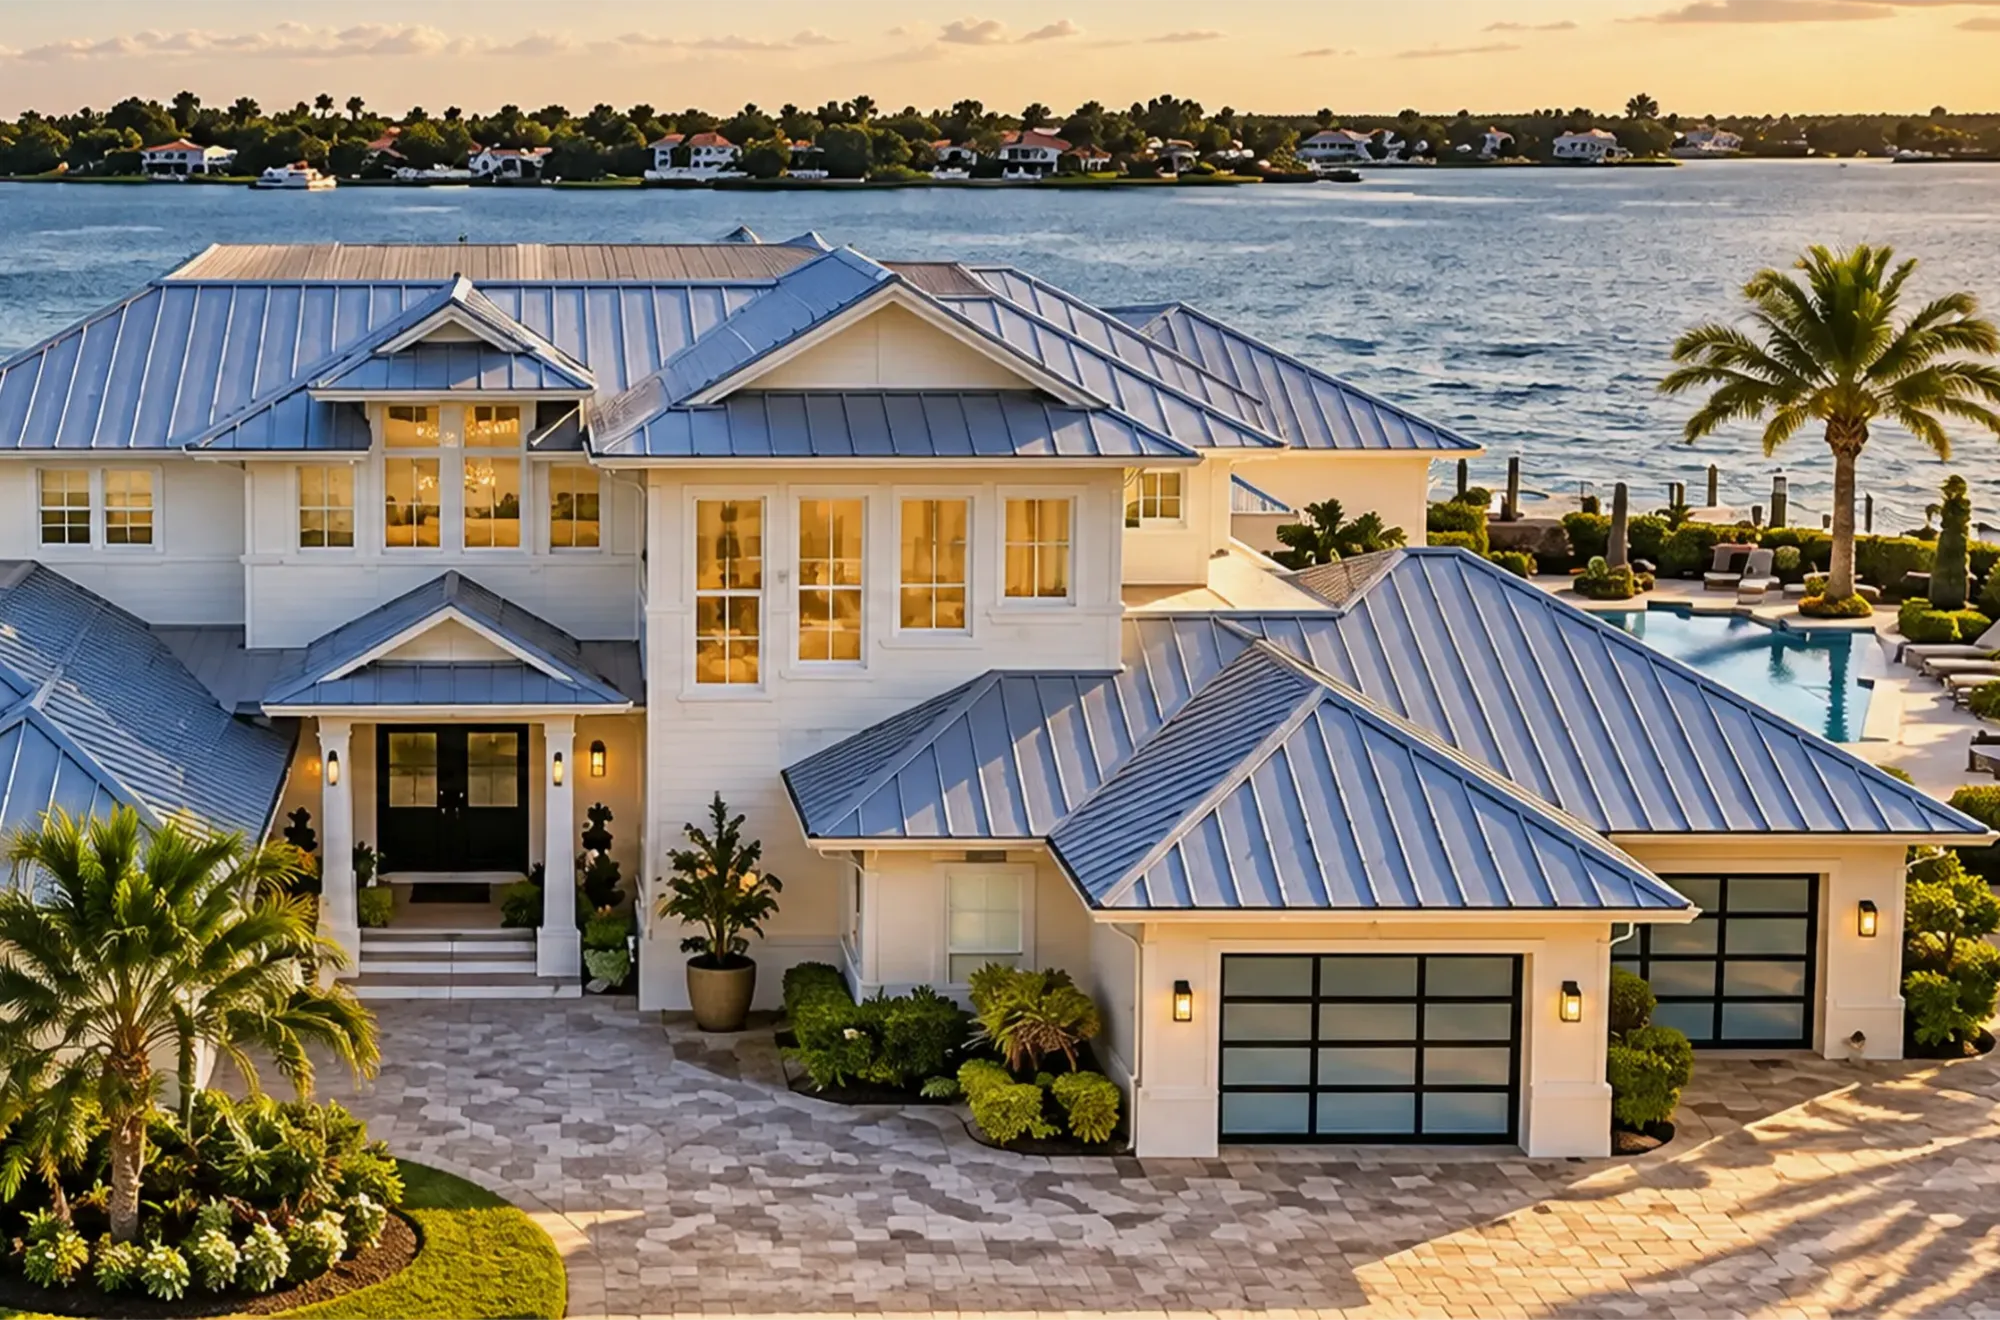
Naples Waterfront Homes
Communities
- Port Royal
- Aqualane Shores
- Royal Harbor
- The Moorings
- Park Shore
- Isles of Collier Preserve
2026 Q1–Q3 Sales
- Port Royal: 24 sales at a $18,300,000 median
- Aqualane Shores: 22 sales at a $10,400,000 median
- The Moorings: 49 sales at a $5,200,000 median
- Royal Harbor: $1,141 a square foot
- Source: NABOR MLS closed sales, January to September 2026
Old Naples and Downtown Homes
Communities
- Old Naples
- Aqualane Shores
- Coquina Sands
- Park Shore
- Gordon Drive
2026 Q1–Q3 Sales
- Old Naples: 47 sales at a $6,400,000 median
- Park Shore: 45 sales at a $4,880,000 median
- Old Naples: $1,564 a square foot
- Highest 2026 Q1–Q3 sale: $62,500,000, in Old Naples
- Source: NABOR MLS closed sales, January to September 2026

Naples Golf Community Homes
Communities
- Grey Oaks
- Quail West
- Mediterra
- Talis Park
- Pelican Marsh
- Fiddler’s Creek
- The Vineyards
2026 Q1–Q3 Sales
- Grey Oaks: 28 sales at a $4,872,500 median
- Quail West: 36 sales at a $3,922,500 median
- Pelican Marsh: 53 sales at a $1,550,000 median
- Fiddler’s Creek: 81 sales at a $1,245,000 median
- Source: NABOR MLS closed sales, January to September 2026
Naples Home Prices by Community
Location sets price more than size. Port Royal homes sold for a median $18,300,000 in 2026 and Aqualane Shores for $10,400,000, while Golden Gate Estates, the largest single market with 567 sales, sold at a median $569,000. The table covers the 145 Naples communities with five or more 2026 sales, plus Marco Island.
| Community | Sales | Median price | Per sq ft | Days on market | Sold to list |
|---|---|---|---|---|---|
| Port Royal | 24 | $18,300,000 | $3,056 | 113 | 91.7% |
| Aqualane Shores | 22 | $10,400,000 | $1,811 | 133 | 89.7% |
| Old Naples | 47 | $6,400,000 | $1,564 | 117 | 92.9% |
| Moorings | 49 | $5,200,000 | $1,288 | 79 | 93.7% |
| Park Shore | 45 | $4,880,000 | $1,216 | 48 | 93.0% |
| Grey Oaks | 28 | $4,872,500 | $1,104 | 53 | 96.4% |
| Talis Park | 13 | $4,625,000 | $1,106 | 34.5 | 95.6% |
| Pine Ridge | 18 | $4,225,000 | $987 | 104 | 92.1% |
| Quail West | 36 | $3,922,500 | $977 | 56.5 | 94.5% |
| Pelican Bay | 30 | $3,400,000 | $972 | 88 | 92.4% |
| Vanderbilt Beach | 20 | $3,125,000 | $1,025 | 115 | 91.9% |
| Mediterra | 25 | $3,100,000 | $865 | 78.5 | 93.9% |
| Royal Harbor | 18 | $3,087,500 | $1,141 | 97.5 | 90.4% |
| Tiburón | 7 | $2,825,000 | $828 | 69 | 92.7% |
| Collier’s Reserve | 14 | $2,400,000 | $597 | 93 | 89.2% |
| Quail Creek | 16 | $2,344,500 | $584 | 101 | 93.3% |
| Lake Park | 13 | $2,250,000 | $943 | 167 | 91.9% |
| Treviso Bay | 17 | $2,225,000 | $752 | 22.5 | 95.4% |
| Ardena | 6 | $1,987,500 | $535 | 107 | 92.9% |
| Isles of Collier Preserve | 59 | $1,900,000 | $743 | 42 | 95.6% |
| Livingston Woods | 7 | $1,900,000 | $814 | 114 | 88.2% |
| Audubon | 17 | $1,800,000 | $558 | 83 | 90.0% |
| Caymas | 20 | $1,790,000 | $651 | 87 | 94.7% |
| Windstar | 6 | $1,762,500 | $699 | 27 | 95.2% |
| Esplanade | 39 | $1,750,000 | $698 | 35 | 95.7% |
| Monterey | 15 | $1,720,000 | $601 | 53 | 94.7% |
| The Quarry | 27 | $1,635,000 | $558 | 24 | 94.9% |
| Kensington | 15 | $1,600,000 | $580 | 90.5 | 93.3% |
| Marco Island | 325 | $1,565,000 | $699 | 71 | 94.1% |
| Pelican Marsh | 53 | $1,550,000 | $565 | 47 | 95.0% |
| Oakes Estates | 13 | $1,475,000 | $475 | 33 | 96.8% |
| Wyndemere | 17 | $1,425,000 | $509 | 47 | 94.2% |
| The Strand | 12 | $1,415,000 | $499 | 9.5 | 94.9% |
| Naples Reserve | 45 | $1,395,000 | $529 | 47 | 96.2% |
| Collier Woods | 8 | $1,390,000 | $524 | 82 | 95.0% |
| Vineyards | 46 | $1,390,000 | $475 | 51 | 95.0% |
| Banyan Woods | 5 | $1,350,000 | $460 | 118 | 92.8% |
| Crossings | 10 | $1,327,500 | $489 | 92 | 91.7% |
| Esplanade by the Islands | 27 | $1,278,079 | $447 | 95.5 | 94.7% |
| Lamorada | 13 | $1,275,000 | $458 | 35 | 95.1% |
| Olde Cypress | 17 | $1,275,000 | $527 | 13 | 97.8% |
| Big Cypress | 7 | $1,245,000 | $667 | 60 | 91.4% |
| Fiddler’s Creek | 81 | $1,245,000 | $504 | 63 | 94.6% |
| Naples Lakes Country Club | 9 | $1,242,500 | $482 | 11 | 95.0% |
| Stonecreek | 25 | $1,200,000 | $387 | 80 | 93.9% |
| Greyhawk at Golf Club of the Everglades | 22 | $1,192,000 | $467 | 63 | 95.0% |
| Wilshire Lakes | 10 | $1,165,000 | $403 | 82.5 | 94.4% |
| Twin Eagles | 35 | $1,150,000 | $394 | 83 | 94.2% |
| Marbella Isles | 12 | $1,132,500 | $406 | 64.5 | 92.4% |
| Lely Resort | 84 | $1,076,000 | $460 | 73 | 94.0% |
| Imperial Golf Estates | 27 | $1,060,000 | $394 | 75 | 93.4% |
| Autumn Woods | 12 | $1,045,000 | $421 | 39 | 95.5% |
| Mockingbird Crossing | 8 | $1,016,250 | $379 | 126 | 96.5% |
| Isles of Capri | 13 | $1,000,000 | $581 | 96.5 | 94.4% |
| Heritage Bay | 12 | $988,750 | $444 | 97 | 96.1% |
| Valencia Trails | 32 | $987,500 | $467 | 75.5 | 95.8% |
| Gulf Shores | 6 | $970,000 | $612 | 58.5 | 91.1% |
| Black Bear Ridge | 5 | $950,000 | $346 | 69 | 95.0% |
| Riverstone | 29 | $950,000 | $333 | 47 | 94.8% |
| Avery Square | 5 | $925,000 | $437 | 51 | 96.3% |
| Marbella Lakes | 5 | $895,000 | $319 | 32 | 95.7% |
| Winding Cypress | 27 | $890,000 | $406 | 74.5 | 96.0% |
| Hacienda Lakes | 29 | $875,000 | $360 | 51.5 | 95.8% |
| Valencia Sky | 15 | $852,900 | $415 | 133 | 100.0% |
| Longshore Lake | 30 | $850,000 | $353 | 28 | 95.5% |
| Indigo Lakes | 13 | $835,000 | $296 | 53 | 95.9% |
| Logan Woods | 24 | $823,750 | $443 | 60 | 93.2% |
| Raffia Preserve | 14 | $810,000 | $331 | 51.5 | 96.2% |
| Boca Palms | 5 | $800,000 | $359 | 67.5 | 92.1% |
| Carlton Lakes | 8 | $792,500 | $331 | 16.5 | 98.2% |
| Beachwalk | 5 | $790,000 | $491 | 45 | 94.9% |
| Eagle Creek | 14 | $790,000 | $274 | 89 | 91.3% |
| Naples Park | 98 | $790,000 | $520 | 67 | 94.3% |
| Cypress Woods Golf and Country Club | 7 | $780,000 | $390 | 32 | 95.8% |
| Briarwood | 22 | $775,000 | $366 | 46 | 95.7% |
| Port of the Islands | 9 | $775,000 | $416 | 40 | 94.9% |
| Brookside | 12 | $772,500 | $520 | 48 | 93.1% |
| Vanderbilt Country Club | 5 | $760,000 | $378 | 10 | 91.6% |
| Compass Landing | 12 | $755,000 | $298 | 56 | 97.1% |
| Naples Bath and Tennis | 6 | $755,000 | $328 | 54.5 | 92.3% |
| Acreage Header | 6 | $747,500 | $395 | 59.5 | 92.7% |
| Victoria Park | 6 | $739,500 | $413 | 4 | 100.0% |
| Royal Palm Golf Estates | 20 | $735,000 | $331 | 62 | 96.0% |
| Aviano | 6 | $732,500 | $339 | 76.5 | 96.6% |
| Glen Eden | 7 | $725,000 | $397 | 70 | 96.1% |
| Madison Park | 12 | $717,500 | $325 | 32.5 | 96.8% |
| Andalucia | 9 | $710,000 | $308 | 30 | 96.6% |
| Bent Creek Preserve | 18 | $710,000 | $293 | 62.5 | 95.4% |
| Verona Walk | 29 | $710,000 | $342 | 46 | 96.8% |
| Delasol | 8 | $705,000 | $332 | 28.5 | 96.5% |
| Kings Lake | 14 | $702,500 | $286 | 61.5 | 94.6% |
| Island Walk | 48 | $700,000 | $329 | 64 | 96.6% |
| Willoughby Acres | 17 | $700,000 | $375 | 55 | 97.2% |
| Palm River | 7 | $695,000 | $326 | 97 | 97.9% |
| River Reach | 7 | $695,000 | $374 | 35 | 96.6% |
| Copper Cove Preserve | 13 | $690,000 | $314 | 46 | 96.5% |
| Saturnia Lakes | 19 | $685,000 | $306 | 45 | 95.9% |
| Village Walk | 19 | $680,000 | $368 | 39 | 96.4% |
| Foxfire | 9 | $669,900 | $419 | 8 | 95.2% |
| Countryside | 13 | $652,000 | $375 | 110 | 94.9% |
| Palm River Estates | 13 | $650,000 | $346 | 74 | 92.4% |
| Lely Country Club | 12 | $647,500 | $301 | 45 | 96.0% |
| Terreno at Valencia | 37 | $645,000 | $326 | 35.5 | 95.9% |
| Manatee Cove | 7 | $640,000 | $312 | 61 | 97.3% |
| Pebblebrooke Lakes | 7 | $640,000 | $262 | 47 | 95.8% |
| Lely Golf Estates | 5 | $630,000 | $296 | 50 | 98.3% |
| Glen Eagle | 13 | $625,000 | $324 | 66 | 96.8% |
| Quail Creek Village | 8 | $622,500 | $242 | 46 | 93.1% |
| Canopy | 6 | $605,000 | $297 | 80 | 94.1% |
| World Tennis Center | 5 | $600,000 | $280 | 67 | 94.5% |
| Laurel Lakes | 7 | $599,000 | $278 | 26 | 96.8% |
| Berkshire Lakes | 31 | $590,000 | $317 | 45 | 96.5% |
| Forest Park | 5 | $590,000 | $291 | 68 | 97.1% |
| Regent Park | 6 | $587,500 | $317 | 28 | 94.8% |
| Valencia Country Club | 20 | $577,500 | $215 | 63 | 99.2% |
| Artesia | 29 | $572,500 | $299 | 60 | 96.0% |
| Sun Terrace | 5 | $570,000 | $404 | 33 | 97.6% |
| Golden Gate Estates | 567 | $569,000 | $325 | 52.5 | 97.8% |
| Crown Pointe | 7 | $560,000 | $293 | 67 | 96.0% |
| Skysail | 27 | $558,947 | $250 | 75.5 | 95.2% |
| Waterways of Naples | 20 | $552,500 | $239 | 65.5 | 97.2% |
| Gulf Harbor | 5 | $550,000 | $314 | 181 | 91.8% |
| Orange Blossom Ranch | 54 | $550,000 | $225 | 51.5 | 97.2% |
| Summerlit in Naples | 5 | $550,000 | $285 | 90 | 95.7% |
| Reflection Lakes of Naples | 13 | $545,000 | $265 | 72 | 95.9% |
| Sterling Oaks | 12 | $544,450 | $294 | 43.5 | 98.3% |
| Heritage Greens | 5 | $535,000 | $291 | 158 | 97.3% |
| Hilltop | 5 | $534,000 | $402 | 14 | 96.6% |
| Ibis Cove | 7 | $525,000 | $297 | 48 | 97.6% |
| Valencia Lakes | 16 | $522,500 | $224 | 99 | 97.4% |
| Maplewood | 10 | $501,500 | $332 | 36 | 98.4% |
| Flamingo Estates | 7 | $495,000 | $326 | 131 | 96.7% |
| Lakewood | 14 | $493,000 | $315 | 76 | 97.6% |
| Golden Gate City | 72 | $485,000 | $332 | 16 | 99.1% |
| Moon Lake | 9 | $480,000 | $292 | 81 | 95.2% |
| Queens Park | 9 | $480,000 | $296 | 31 | 97.9% |
| Hallendale | 5 | $475,000 | $325 | 133 | 90.4% |
| Poinciana Village | 11 | $475,000 | $339 | 52 | 95.4% |
| Fronterra | 6 | $450,000 | $278 | 47.5 | 97.6% |
| Naples South | 10 | $407,500 | $265 | 54 | 96.5% |
| Riviera Golf Estates | 18 | $402,500 | $232 | 66 | 95.4% |
| Naples Manor | 13 | $380,000 | $300 | 52 | 94.4% |
| Trail Acres | 5 | $370,000 | $332 | 56 | 97.6% |
| Lely Tropical Estates | 9 | $360,000 | $278 | 12 | 99.2% |
| Leawood Lakes | 6 | $352,500 | $227 | 32 | 97.5% |
| Royal Arms Villas | 5 | $317,900 | $265 | 47 | 93.4% |
Show all 146 communitiesShow fewer communities
Where Are the Homes in Naples?
Naples runs about 20 miles along the Gulf of Mexico, from Wiggins Pass in the north to Rookery Bay and the Ten Thousand Islands in the south. The oldest and most expensive homes sit close to the Gulf in central Naples: Old Naples, Port Royal, Aqualane Shores and The Moorings.
North of Pine Ridge Road, Pelican Bay and Vanderbilt Beach line the coast, while most golf and master-planned communities lie inland along Immokalee, Vanderbilt Beach and Livingston Roads. Golden Gate Estates, east of Interstate 75, is the largest single market for acreage homes.
Naples Luxury Homes Above $1 Million
Homes of $1 million and above made up 40% of Naples sales in 2026 but 77% of the money spent on Naples homes. Their 1,362 sales had a median price of $1,950,000, $651 a square foot, and closed at 93.9% of list price after a median 65 days. To see what is available at this level today, browse Naples luxury homes for sale.
206 homes sold for $5 million or more and 66 for $10 million or more; the highest was $62,500,000 in Old Naples. A share of these never reach the public market: 59 of the $1 million-plus sales were private sales entered in the MLS only after closing. For waterfront homes specifically, see Naples waterfront homes, and for canal homes with a route to open water, Gulf access homes.
Naples Homes by Price Range
The busiest range in 2026 was $500,000 to $749,999, with 1,033 sales, 30% of the market. Homes under $500,000 are scarce: 475 sold in nine months, 128 of them under $400,000, and only 112 were listed at the end of September.
Supply rises with price. Under $500,000 there is less than three months of inventory, which favors sellers; above $5 million there are close to nine months or more, which gives buyers room to negotiate.
| Price range | Sales | Share | Per sq ft | Days on market | Sold to list | Active listings | Months of supply |
|---|---|---|---|---|---|---|---|
| Under $400,000 | 128 | 4% | $268 | 31.5 | 96.7% | 17 | 1.2 |
| $400,000 to $499,999 | 347 | 10% | $292 | 52 | 97.1% | 95 | 2.5 |
| $500,000 to $749,999 | 1,033 | 30% | $321 | 54 | 96.8% | 459 | 4.0 |
| $750,000 to $999,999 | 556 | 16% | $380 | 64.5 | 95.8% | 323 | 5.2 |
| $1 million to $1,999,999 | 693 | 20% | $510 | 57 | 94.0% | 402 | 5.2 |
| $2 million to $4,999,999 | 463 | 14% | $825 | 63 | 93.9% | 264 | 5.1 |
| $5 million to $9,999,999 | 140 | 4% | $1,388 | 106 | 93.7% | 137 | 8.8 |
| $10 million and above | 66 | 2% | $2,330 | 114.5 | 92.1% | 80 | 10.9 |
Naples Homes, Considered Carefully
More than 280 communities, each with its own fees, rules and rhythm. We’ll narrow them to the few worth your time.
Arrange a ConsultationBuying a Home in Naples
What to expect between offer and closing.
- Typical negotiation
- Naples homes sold at a median 95.6% of list price in 2026, nearer list under $500,000 and further below it above $5 million.
- Cash buyers
- Much of the luxury market buys without a mortgage, so financing contingencies matter most below about $1 million.
- Closing costs
- In Florida the documentary stamp tax on a deed is $0.70 per $100 of price, customarily paid by the seller in Collier County.
- Inspections
- Ask for a wind-mitigation and four-point inspection; insurers use both to price and approve a policy.
- Flood zones
- Much of coastal Naples lies in FEMA flood zones, where lenders require flood insurance. Check the zone and elevation certificate early.
Owning a Home in Naples
The carrying costs buyers most often underestimate.
- Homeowners insurance
- Premiums depend on age of roof, construction, wind protection and flood zone, and can be one of the largest annual costs.
- Homestead exemption
- A primary residence qualifies for up to $50,000 off its assessed value, and Save Our Homes caps yearly assessment increases at 3%.
- Property taxes
- Taxes reset to market value on purchase, so the seller’s bill is rarely a guide to yours.
- HOA and club fees
- Many communities carry mandatory association dues, and some bundle golf membership into every home; budget both before you buy.
- Seasonal use
- Many Naples owners are part-time residents; rental rules vary by community and some restrict leases.
Insider Information
The Naples, FL single-family home market operates as a collection of hyper-local micro-markets where national real estate trends and blanket negotiating strategies do not apply. The market is starkly divided between a mortgage-sensitive financed segment and an ultra-luxury cash segment where high interest rates are largely irrelevant. Buyers must also account for invisible carrying costs, including high insurance premiums and mandatory HOA or bundled golf fees that can significantly increase baseline expenses.
You can read more in our Naples real estate market research.
From Dan Boyle, October 2026
Naples Schools
Collier County Public Schools serves every Naples neighborhood, and assignment runs by parcel rather than by neighborhood: two houses on the same street can be zoned for different schools, and the district redraws boundaries from time to time.
Each of our neighborhood guides lists the elementary, middle and high school assigned to a representative address in that community, and our Collier County school zones guide compares them in one place. Confirm the assignment for the specific address with the district before you rely on it.
The district states that its maps provide general information and that accuracy is not guaranteed. Look up any address on the CCPS attendance zone locator, or call the Department of Student Assignment on (239) 377-0540.
Naples Homes FAQs
How much does a home cost in Naples, Florida?
Single-family homes in Naples sold for a median $825,000 from January to September 2026, with the middle half of sales between $575,000 and $1,603,000. The median price per square foot was $387. Prices range from under $400,000 inland to more than $18 million in Port Royal.
Is the Naples real estate market going up or down?
Up modestly. From January to September 2026, the median Naples home price rose 4.9% and closed sales rose 11.6% over the same months of 2025, while days on market fell from 63 to 58. The gains were strongest above $1 million.
Is Naples a buyer’s or seller’s market?
It depends on price. With 1,777 homes listed at the end of September 2026, Naples had about 4.7 months of supply overall. Under $500,000 there was less than three months, favoring sellers; above $5 million there were roughly nine months or more, giving buyers leverage.
Can you buy a home in Naples for under $500,000?
Yes, but few. 475 Naples homes sold under $500,000 from January to September 2026, 128 of them under $400,000, about 14% of all sales. About a third are in Golden Gate Estates and most of the rest in Golden Gate City and older East Naples neighborhoods, and they sell quickly, in a median 31.5 days under $400,000.
What are the most expensive neighborhoods in Naples?
Port Royal had the highest 2026 median home price of any Naples community, $18,300,000. Aqualane Shores ($10,400,000), Old Naples ($6,400,000), The Moorings ($5,200,000) and Park Shore ($4,880,000) followed, all on or near the Gulf in central Naples. Each has its own guide: Port Royal, Aqualane Shores, Old Naples, The Moorings and Park Shore.
How long do homes take to sell in Naples?
The median Naples home sold in 58 days in 2026, down from 63 a year earlier. Homes under $500,000 sold fastest; homes above $5 million took a median of more than 100 days.
Narrow Your Naples Home Search
Considering a Home in Naples?
Neighborhoods here differ in fees, club rules and flood zones as much as in price. Tell us how you intend to live, and we’ll narrow the map.
Speak With Our Team